Web performance audit: the importance of monitoring your site’s pages

As part of a complete redesign of a site, the implementation of a new function or in TMA, page loading time is now a key element to be monitored and followed up after each production launch to ensure that it satisfies the current standard of free or paid speed testing tools and above all the requirements of Internet users, especially on mobile devices.
According to data provided by Google:
- – 0.1 seconds of loading time can lead to +8% conversions
- 53% of mobile users leave a page if it takes more than 3 seconds to load
- 77% of smartphone users are more likely to make a purchase from a company if its website or mobile application enables them to complete their purchase quickly.
A few tenths of a second more loading time is unfortunately a recipe for losing conversion points, and therefore sales, as well as having a negative impact on your natural search engine optimisation (SEO) and even your search engine advertising (SEA) via the Quality Score.
It is therefore essential to pay constant attention to the loading time of your pages in order to :
- Offer the best user experience to your prospects and customers, resulting in longer visits and more page views
- Increase your conversion rate to generate more leads and sales
- Optimise your natural referencing whose loading time is one of the criteria in Google’s algorithm
Since 2020, Google has become the master in this field by defining key performance measurement indicators (Core Web Vitals) for websites with the aim of evaluating loading speed and the user experience on sites. Google has provided free tools (Search Console, Google Lighthouse, Page Speed Index) for testing and monitoring these key performance indicators.
What are the 3 main Core Web Vital indicators to follow?
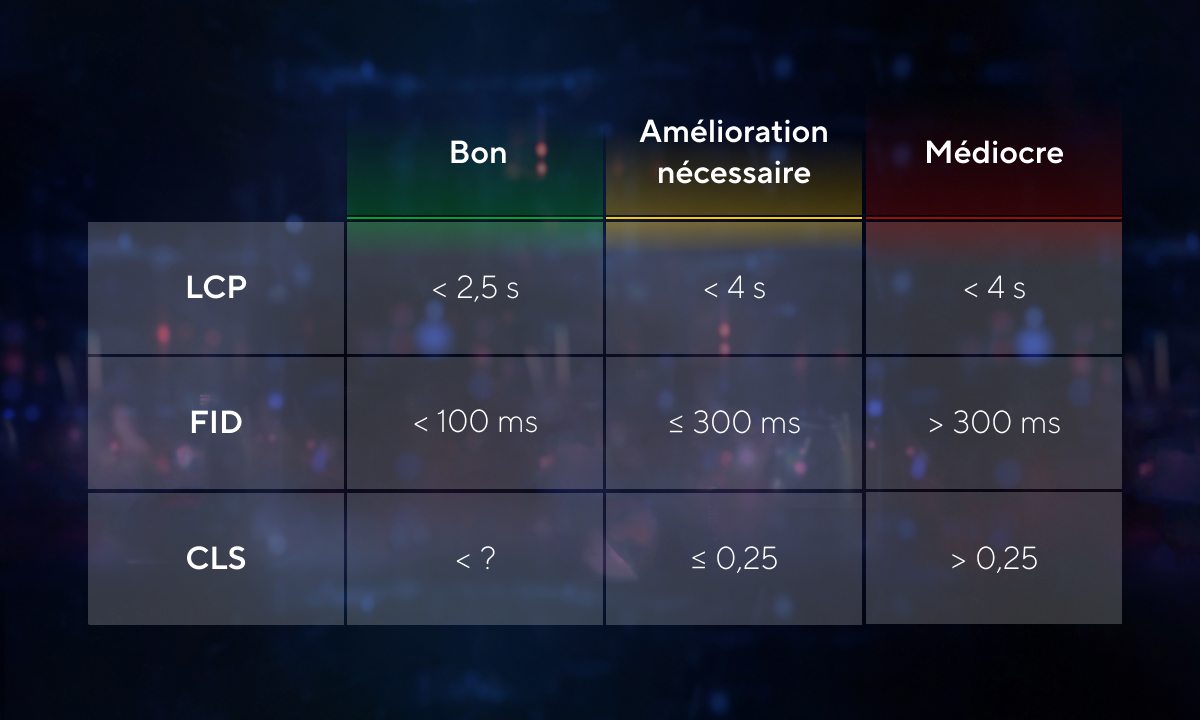
Largest contentful Paint (LCP)
This is the time taken by the browser to display the largest element visible in the display window from the moment the Internet user tries to access the URL.
The LCP only concerns the main content above the waterline. Images, videos or blocks of text are displayed without the user having to scroll.
First Input Delay (FID) / Interaction Next Page (INP)
This is the delay between the moment when the user first interacts with the page displayed and the moment when the browser responds to this interaction. This calculation is used to quantify the user experience.
A low FID guarantees loading time, responsiveness and therefore a successful overall experience. FID will be replaced by INP in 2024, which assesses the overall responsiveness of all interactions on a web page, rather than just the first. It provides a more coherent overall feedback.
A good INP corresponds to a value of 200 ms maximum (100ms for the FID).
Cumulative Layout Shift (CLS)
CLS calculates the total sum of scores for each layout shift that occurs during loading and throughout the life of the page.
Shifting elements stops users from interacting correctly, thus impacting the user experience.
Two other indicators more related to your infrastructure should also be monitored:
Time To First Byte (TTFB)
This is an index that measures the time between the request for a resource and the moment when the first byte of a response begins to arrive.
As TTFB precedes user-centric indices such as First Contentful Paint (FCP) and Largest Contentful Paint (LCP), it is recommended that your server responds to browser requests quickly enough not to impact their score.
As a guide, most sites should aim to have a TTFB of less than 0.8 seconds.
First Contentful Paint (FCP)
It measures the time elapsed between the start of page loading and the moment when part of the page content is displayed on the screen.
For a good user experience, your site should have a First Contentful Paint of less than 1.8 seconds.
Google’s tools give a good trend, but only reflect users’ results at a given moment. Relying on other tools such as NewRelic, GTMetrix, WebPage Test, and others, enables a site to be analysed continuously, or in real time, taking into account deployments and peaks in activity.
Performance analysis also needs to be adapted according to the context, technologies and CMS used. For example, the analysis will be different
between a WordPress, a Adobe Commerce and a CMS used with a Front Headless versus a solution-driven front.
As a priority, you need to set measurable and quantifiable objectives in terms of improving your web performance KPIs.
Here are some best practices to follow:
Measure yourself against your competitors
The tools also allow you to compare the performance of your site with those of your competitors. It’s always a good idea to benchmark yourself against others. Being in the “green” may not be enough if your competitors are better than you.
The main front-end technical points to consider
- The quality of the HTML code : number of elements in the dom, use of appropriate tags, attributes filled in, …
- Style sheets (CSS) : compression, caching, versioning, CDN, level/targeting, …
- The javascript : compression, caching, versioning, CDN, size of files loaded, number of requests, multiple calls, loading of third-party scripts, deferring certain loads, correcting errors that slow down loading (even if they don’t block) …
- And the assets (Content, media…) : image compression, use of a CDN, use of next-generation formats, implementation of a Lazyload, adaptation of loaded fonts to use (by adapting the number of glyphs), adaptation of loaded images according to resolution, etc.
The main indicators to analyse when monitoring back-end performance are as follows:
- Database performance: as data is processed and retrieved from the database, it is important to ensure that queries are executed as quickly and reliably as possible. It may sometimes be useful to add indexes or optimise certain queries in order to obtain faster response times and improve overall application performance as well as the platform’s load-bearing capacity (scalability).
- Server load time: this is the time it takes for your server to respond to a request and return the page to the user. The shorter the better. After optimising the DB, it can be useful to improve the cache system in place to make it more efficient and thus drastically reduce page load times. To do this, you need to adjust the granularity of the cache, its lifespan, check its effectiveness, …
- The server error rate: some pages called up generate errors. You need to aim for as few errors as possible. Errors sent back to the application generate longer loading times because of the error itself, which has to be processed, and the writing of logs, which generates unnecessary disk I/O and therefore load.
Always bear in mind that optimising performance starts at the technical design stage, with the creation of mock-ups and navigation paths. During integration, developers must be trained in best practice.
In line with your objectives, it is essential to choose the right balance between optimising the user experience for your customers and stubbornly trying to conform to a model that satisfies Google’s algorithm, the content and updates of which are beyond anyone’s control.