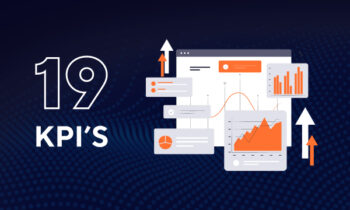
The KPIs that speak volumes about the relevance of your advertising
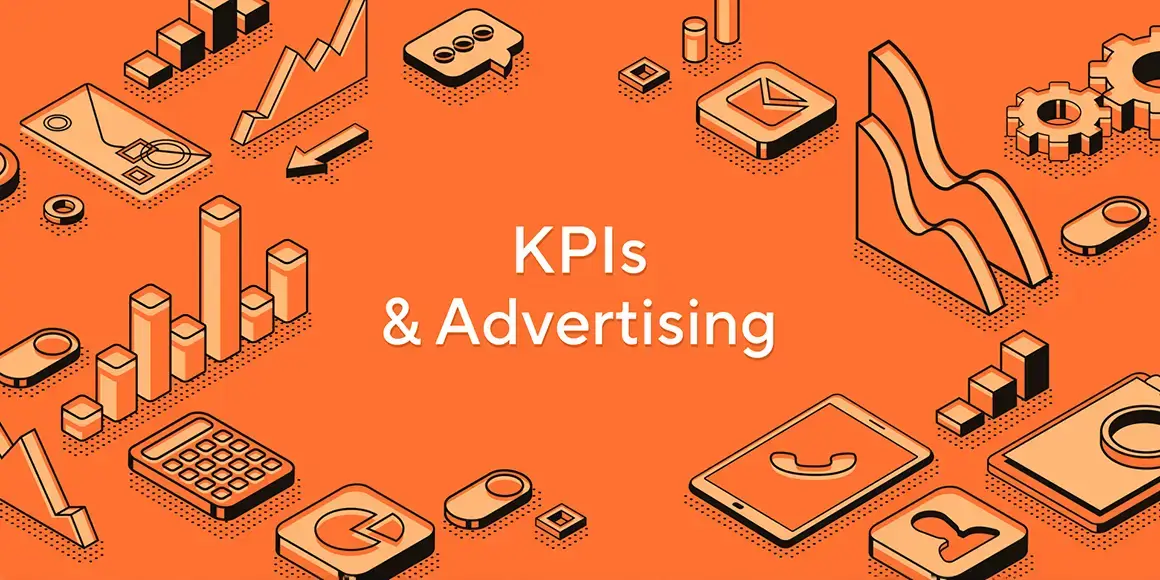
If you are connected to the digital field, you have probably already heard of the famous KPIs. These “Key Performance Indicators” are very important as they allow you to measure the impact of your marketing actions. Once overlooked a few years ago, they have become essential parameters to analyze for any company that advertises online.
Newsletters, Google Ads, Facebook Ads, Social Media… A multitude of tools through which you promote your products and services. Creating an advertisement is good, but knowing how to choose and interpret the right KPIs is even better!
DATASOLUTION provides you with all the keys in this article.
The KPIs of your Facebook ads
Facebook and Business Manager are essential tools for the majority of you. Choosing the budget, getting started quickly, selecting a custom audience… Simple and practical settings for high-performing ads. As we mentioned earlier, setting up the promotional strategy, creating ads, and scheduling them are good starting points. But the hardest part is yet to come! To find out if you have chosen the best strategy, you need to select the right key performance indicators.
When launching a Facebook advertising campaign, we advise you to select a minimum of 3 KPIs that we will present to you. These are the fundamental indicators that are essential for a proper performance analysis.
Impressions
You sometimes tend to forget, but these Facebook ads have the role of delivering a message to as many people as possible. You share your products and services so that people pay attention to them and so that the largest number of Facebook users come across them.
Impressions, which allow you to obtain the number of people who have seen your campaign, play an important role in the analysis of your metrics. It’s obvious: the higher your campaign budget, the more chances you have to increase the number of views of your advertisement. Reach is a metric that indicates how many people have seen your ad.
For example, if your Facebook ad is shown to 1000 users, the coverage of your campaign will be 1000. It is essential to pay close attention to this indicator and understand ways to improve it.
Exactly, it should not be confused with impressions, which correspond to the number of times your content was displayed on the screen. In general, the number of impressions is always higher than the coverage, due to the repetition rate.
Cost per result
You are not familiar with the Cost Per Result (CPR) yet? It’s our second performance indicator and probably the most closely watched by advertisers. You should know that the result of this KPI will vary depending on the objective of your Facebook campaign. If you want to encourage your target audience to make a purchase, then the displayed result will be the Cost Per Purchase. In other words, how much do you need to spend on Facebook ads to get one purchase on your website? The same goes for all other objectives related to your campaign (click on a link, app installation, engagement on the ad, video view, etc.).
Le ROAS
The ROAS (Return on Advertising Spend) is an essential metric when it comes to Facebook KPIs. It provides you with an overall view of the effectiveness of your ads. It is calculated simply by dividing the revenue generated by the total amount spent on advertising. If your ROAS is greater than 1, you are generating more revenue than you spent (which means you are making a profit). If it is less than 1, you are generating less revenue than what you spent (which means you are losing money). Got it?
Are you using these key performance indicators that provide valuable insights into your advertisements? Not yet? It’s time to implement them and take the time to analyze them to understand what works (or doesn’t) regarding your Facebook campaigns.

The KPIs for your email campaigns
Do you use MailChimp, SendInBlue, or another system for creating and scheduling newsletters for your company? Do you advertise your products and services through this communication channel?
These tools are very convenient for sending email campaigns to your customers or potential targets. Beautiful newsletters, templates, and content to showcase. However, the key to improving your newsletters lies in the proper analysis of your statistics. We propose 3 new KPIs to closely monitor after sending your newsletters.
Open Rate
The first, which seems obvious to us, is the open rate. It is the percentage of the number of times your recipients have opened your email. This indicator will tell you if your newsletters continue to interest your database over time. If this rate increases, you are on the right track: your email campaigns are appreciated, and your techniques are effective! On the other hand, if you experience a decline in this rate, it’s time to review your newsletters and implement certain optimizations!
Click-Through Rate (CTR)
After opening your newsletter, you probably encourage your recipients to take a specific action. To click somewhere, perhaps? This is measured by the Click-Through Rate (CTR), our second special email KPI! It represents the percentage of the number of times people clicked on one of the links in your newsletter. It is essential to consider and not neglect. It helps you understand which content interests your recipients the most.
Conversion Rate
When you send a newsletter, you are likely expecting your recipients to take a certain action. This could be visiting your website, making a purchase, or simply watching a video. This is known as the conversion rate, our third KPI related to your email campaigns. Unfortunately, most autoresponders do not provide accurate measurement of these parameters.
However, there is another simple method to measure this conversion rate. Just go to Google Analytics and set up goals to measure your business actions. It will also be necessary to add UTM parameters to your links. They help identify and track traffic coming from campaigns in the Analytics interface. This conversion rate allows you to measure the percentage of times your recipients performed the desired action.

Measuring performance with Google Analytics (or equivalent tool)
Let’s talk more about Google Analytics and all that it can measure. When launching your advertising campaigns, it is possible to track their performance using this tool. Several KPIs integrated into Analytics are analyzable and provide insights into the relevance of your ads.
Website Traffic (and its growth rate)
This is the metric you should be looking at EVERY day! Knowing the number of visitors to your website gives you an idea of its reach and popularity. The higher the traffic, the more chances you have of attracting new prospects and customers. We recommend setting monthly traffic goals, which will constantly push you to seek an increase in the number of visitors to your website.
To have a clear idea of your website’s health, regularly compare its traffic rate to the previous year. This will show you if, during the same period, your traffic is increasing or decreasing.
Bounce Rate
The bounce rate measures the percentage of visitors who entered a web page and left the site immediately without visiting other pages. For example, an eCommerce site generally has a low bounce rate as visitors browse through multiple product pages. On the other hand, a blog typically has a relatively high bounce rate. Readers arrive on the site to read a specific article and leave after finishing it.
Conversion rate by channel
Previously, we talked about the conversion rate in your email campaigns. Now, let’s discuss the conversion rate by traffic source in Google Analytics. You have the ability to analyze the conversion rate based on the different advertising channels. Your conversion rate will vary depending on your business goals and objectives. Just like your communication channels, which will differ depending on the strategies you have implemented.
The main channels usually include Google (organic or direct), newsletters, and Facebook ads. However, you can select many others based on the communication channels you choose to use.
It’s your turn to take action!
Whether you are promoting your products on Facebook or through newsletter campaigns, take our valuable advice into account to make your business take off. Take the time (at least once a month) to look at these KPIs and conduct a comprehensive analysis.
A detailed analysis of these indicators will allow you to optimize your campaigns and achieve better results consistently!